Reasons for the fall in gold prices for the seventh consecutive day
Gold prices fall below 1,275 and reach the lowest levels this year
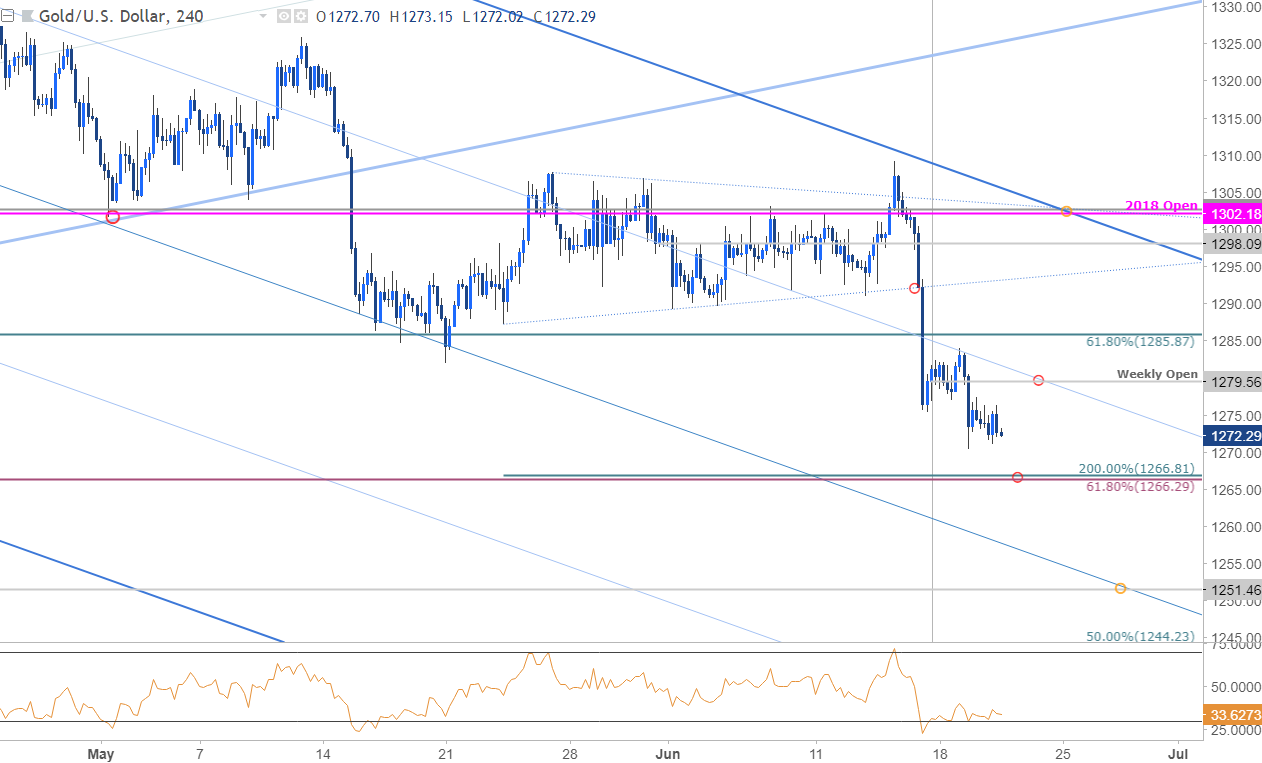
What is the trend in the price of gold in the coming days?
Analysis of gold prices on weekly and daily chart XAU/USD
Reasons for the fall in gold prices for the seventh consecutive day
The series of sharp declines in gold prices continues due to the strength of the US dollar in recent days. The surge in US share prices since the end of last year and the arrival of prices this week at their highest levels in six months has also led to a decline in traders ' fears and many of them have turned into markets with higher and more serious returns. This increased demand from traders has led to a risk of falling gold prices for the fourth consecutive week and a result of the frequent sales of gold prices.
Gold prices fall below 1,275 and reach the lowest levels this year
Gold prices have fallen by 3% since closing last month at a price of 1,314 dollars and today reached 1,273 dollars, which is the lowest level it landed in nearly four months. As we note on the weekly chart below, gold prices began to fall with the relative strength index reaching level 70 (the intensive purchasing area), which gave an indication of the likelihood of price declines when the price of gold rose to its highest level in mid-February. On the opposite side we observe the rise in gold prices while the RSI reaches level 30 (intensive sales area).
Get our new forecasts on gold prices, euro vs. USD dollar rates and most other major currency rates to help you make your own trading decisions from here for free
Given the weekly chart, gold prices are likely to continue to fall to the rising trend line at a price of 1,265 dollars, which is located near the 50-day moving average (in blue). Note that we may see the reversal of gold prices and their trend to the resistance level (in red) at the price of 1,293 dollars as we observe each time the gold prices reach the same trend line rising since the middle of last August.
Lower gold prices for the fourth consecutive week and their trend to the moving average for 50 days what is the trend of gold prices in the years to come?
Recent data on China's gross domestic product (GDP) rise by 6.4 percent in the first dividend this year, compared to a projected 6.3 percent, have led many traders to be reassured about the economic situation and turn them into higher-yielding assets, which naturally led to increased pressure The price of gold and its decline for the seventh consecutive day which is the longest series of daily losses during this year as seen on the daily chart below.
In addition, the low unemployment rate in the United States for the fifth week also contributed to the strength of the US dollar and the decline in gold prices, with gold prices dropping by 5 percent from the highest levels it reached on Feb. 20 when gold prices traded at 1,340 dollars.
What is the first error in which most traders are located, and how can this common error be avoided? Find out here for free!
Conclusion: The decline in gold prices from the current level is the most probable, especially after breaking prices for the Fibonacci retracement level of 38.4%. Therefore, we will put the next target at the price of 1,265 dollars as we mentioned earlier on the weekly chart, then we will set the second target at the price of 1,258 dollars which is located near the moving average for 200 days (in blue). If gold prices continue to fall after reaching previous levels, the final target is the Fibonacci retracement level of 38.2% at the price of USD 2388.